Hill Climbing Home Page
|

|
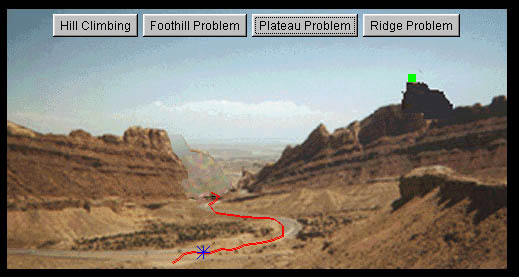
When the applet is loaded, it shows the hill as a back
ground and it also has a button for each of problems talked
above. By clicking the respective button, the applet shows
the search path that will be taken for each of the above
mentioned problems. The search path is represented by a red
line. This red line is obtained by joining all the solution
states taken during the search. The blue lines show
possible solution states around the current state. The green
line indicates the best state obtained at each search point.
The green circle at the top of the hill indicates the actual
goal state that is to reached. The start and stop buttons
are for starting and stopping the search. This applet helps
the user to visualize and thus understand the hill climbing
search technique and also understand the various problems
faced by hill climbing search technique.
|
|

|
Foothills or local maxima is a state that is better than
all its neighbours but is not better than some other states
farther away. At a local maximum, all moves appear to make
things worse. Foothills are potential traps for the
algorithm.
|
|
|
A plateau is a flat area of the search space in which a
whole set of neighbouring states have the same value. On a
plateau, it i not possible to determine the best direction
in which to move by making local comparisons.
|
|
|
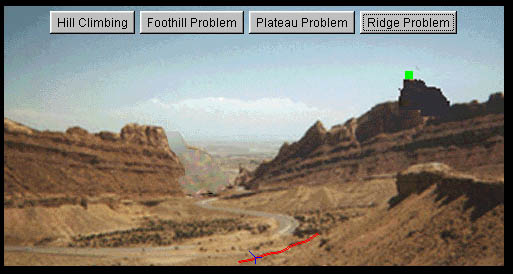
A ridge is a special kind of local maximum. It is an area
of the search space that is higher that the surrounding
areas and that itself has a slope. But the orientation of
the high region, compared to the set of available moves and
the directions in which they move, makes it impossible to
traverse a ridge by single moves. Any point on a ridge can
look like peak because movement in all probe directions is
downward.
|
Resources used for this
visualization
Students taking the NDSU CS 724 course do not need to understand the
internals of the
visualization operation.
These links are to help if you are interested in the internals of the
visualization process. They also should
help if you want to use these visualizations in other environment.
The files used for this system are as follows: